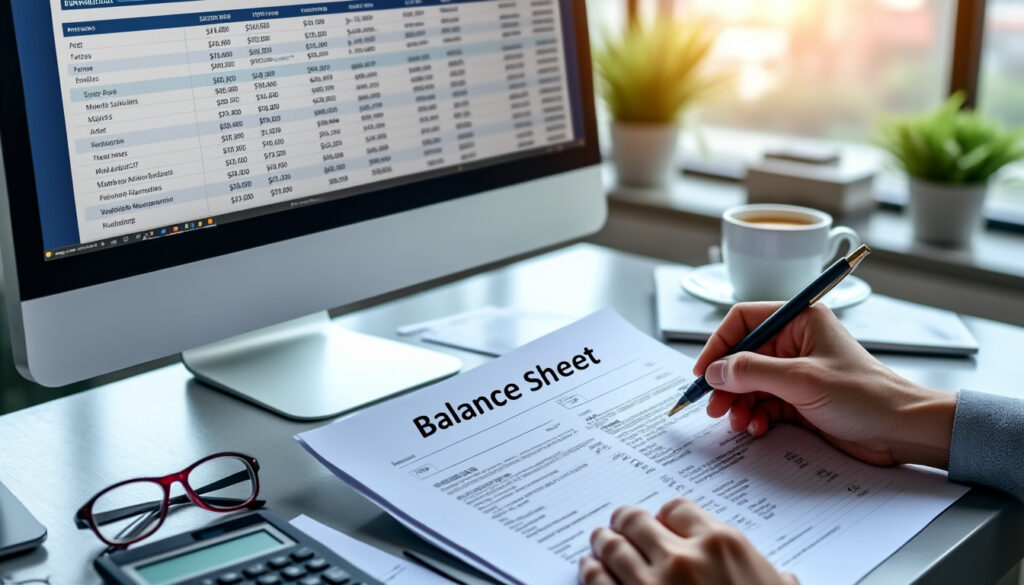
Navigating the world of finance can often feel like deciphering an intricate recipe, especially when confronted with the fundamental document known as a balance sheet. For many, this financial statement appears to be a complex array of figures, yet it holds the key to truly understanding a company’s financial health at a specific moment in time. Far from being an abstract accounting exercise, the balance sheet acts as a vital snapshot, revealing everything a business owns, owes, and the net value left for its owners. Mastering its interpretation isn’t just for seasoned investors; it’s a critical skill for anyone looking to make informed decisions, whether you’re evaluating a potential investment, assessing a competitor, or simply managing your own business. This guide aims to demystify the balance sheet, breaking down its core components and offering clear, actionable insights into reading and understanding this essential financial document, empowering you to see the financial landscape with newfound clarity.
En bref:
- A balance sheet is a financial snapshot of a company’s assets, liabilities, and equity at a precise moment.
- Understanding this statement is crucial for evaluating financial health and making informed decisions.
- The core equation, Assets = Liabilities + Equity, is fundamental to its structure.
- Assets represent what a company owns, liabilities what it owes, and equity the residual value for owners.
- Analyzing trends over time and comparing with industry peers provides deeper insights.
- The balance sheet complements other financial statements like the income statement and cash flow statement.
Unveiling the Balance Sheet: What it is and why it matters
Imagine peering into a company’s pantry and refrigerator, taking a precise inventory of everything it possesses right now. That’s essentially what a balance sheet does: it provides a detailed snapshot of a company’s financial position at a specific point in time, typically at the end of a quarter or fiscal year. Unlike an income statement, which covers a period, the balance sheet is a static view, a single frame capturing the company’s assets, liabilities, and shareholders’ equity. Think of it as the ultimate “what do we have, what do we owe, and what’s left?” report for any business, large or small. For anyone looking to understand business basics for beginners, the balance sheet is an indispensable starting point.
But why is this particular snapshot so crucial? For starters, it’s a cornerstone for assessing a company’s financial stability and liquidity. By examining the types and values of assets, you can gauge a company’s resources. Looking at liabilities reveals its obligations and financial risks. And the equity section tells you about the owners’ stake, providing insight into the company’s long-term health and solvency. Without a clear grasp of the balance sheet, evaluating investment opportunities, understanding creditworthiness, or even comprehending a company’s operational capabilities becomes incredibly challenging. It’s the foundational document that informs investors, creditors, and management alike, guiding decisions that can shape the future of an enterprise.
The fundamental equation: Assets = Liabilities + Equity
At the heart of every balance sheet lies a powerful and simple equation: Assets = Liabilities + Equity. This principle is not just an accounting rule; it’s the very logic upon which the entire document is built, ensuring that everything a company owns is either funded by its debts or by its owners. Understanding this equation is your first step to unlocking the balance sheet’s secrets. Assets represent everything of value that a company owns—cash, inventory, property, equipment, and even intellectual property. These are the resources that generate future economic benefits. For a deeper dive into distinguishing these, consider exploring the difference between assets and current assets.
Liabilities, on the other hand, are what the company owes to others. This includes everything from short-term obligations like accounts payable and salaries to long-term debts such as bank loans and bonds. These are financial obligations that must be settled in the future. Finally, equity, often referred to as shareholders’ equity or owner’s equity, represents the residual value of the company’s assets after all liabilities have been paid off. It’s what belongs to the owners. This fundamental balance underscores that every asset a company possesses must be financed, either through borrowing (liabilities) or through the owners’ investment (equity). This equation must always hold true, providing a robust framework for financial analysis.
Decoding the core components: Assets, liabilities, and equity
To truly understand a balance sheet, you must move beyond the basic equation and delve into the specific categories that comprise its three main sections. Each component offers unique insights into a company’s financial story. Let’s start with assets. These are typically divided into two main groups: current assets and non-current assets. Current assets are those that can be converted into cash within one year, such as cash itself, marketable securities, accounts receivable (money owed to the company), and inventory. These indicate a company’s liquidity and its ability to meet short-term obligations. Non-current assets, conversely, are long-term assets not expected to be converted into cash within a year, including property, plant, and equipment (PPE), long-term investments, and intangible assets like patents and trademarks. These assets reflect a company’s investment in its long-term operational capacity and growth.
Next, we examine liabilities, also split into current and non-current categories. Current liabilities are obligations due within one year, like accounts payable, short-term loans, and accrued expenses. These are critical for assessing a company’s short-term financial health and operational efficiency. Non-current liabilities are long-term obligations, such as long-term debt, deferred tax liabilities, and bonds payable. These give insight into a company’s long-term financial structure and its ability to handle larger, more extended commitments. Understanding these distinctions is paramount for anyone trying to estimate working capital, as current assets and liabilities directly influence this metric.
Finally, shareholders’ equity represents the owners’ residual claim on the company’s assets after liabilities are settled. This section typically includes common stock (the capital raised from selling shares), additional paid-in capital (the amount investors paid above the par value of shares), and retained earnings (profits accumulated over time that have not been distributed as dividends). Equity also includes treasury stock (shares repurchased by the company) and other comprehensive income. A growing equity section often signals a healthy, profitable company that is reinvesting its earnings back into the business, strengthening its financial foundation and building long-term value for its shareholders. By systematically reviewing each of these components, you gain a comprehensive view of where a company stands financially.
Analyzing the balance sheet for actionable insights
Once you understand the individual components, the real power of the balance sheet comes alive through analysis. It’s not just about knowing the numbers, but what those numbers *mean* for a company’s future prospects. One common method is trend analysis, where you compare balance sheets over several periods (e.g., year-over-year). Are assets growing faster than liabilities? Is equity steadily increasing? Consistent growth in assets and equity, coupled with manageable liabilities, often indicates a strong, well-managed company. Conversely, a rapidly increasing debt load or shrinking equity can be red flags that warrant closer investigation.
Another powerful analytical tool involves ratio analysis. By calculating specific ratios from the balance sheet, you can gain immediate insights into liquidity, solvency, and efficiency. For example, the current ratio (current assets / current liabilities) tells you if a company can meet its short-term obligations. A ratio below 1 might suggest liquidity issues. The debt-to-equity ratio (total liabilities / shareholders’ equity) provides a measure of a company’s leverage—how much of its operations are financed by debt versus equity. A high debt-to-equity ratio can signal higher risk. These ratios, when compared against industry benchmarks or historical performance, offer a clearer picture of a company’s financial strengths and weaknesses. For instance, understanding how to calculate loan to deposit ratio for a bank’s balance sheet can be a specific and crucial insight.
When analyzing financial data, it’s important to remember that access to detailed, up-to-date reports is paramount. Sometimes, navigating various online financial platforms or accessing specific datasets can present technical challenges. If you ever find yourself experiencing an access issue with a financial data platform, for example, it’s wise to know how to seek support. Often, contacting the platform’s dedicated help desk, such as a hypothetical ‘support@people.inc,’ and providing details like your IP address (which can be found by visiting ‘icanhazip.com’ or ‘whatismyip.com’) can expedite troubleshooting. Similarly, if you are looking to access financial content for licensing purposes, reaching out to the content licensing department—e.g., ‘contentlicensing@people.inc’—would be the appropriate step. Ensuring smooth access to this critical financial information is just as important as knowing how to interpret it.
Connecting the dots: Balance sheets with other financial statements
While the balance sheet offers a crucial snapshot, its true value is often realized when it’s analyzed in conjunction with the other primary financial statements: the income statement and the statement of cash flows. Think of these three documents as pieces of a larger puzzle, each telling a different but interconnected part of a company’s financial story. The income statement, which reports a company’s revenues and expenses over a period, directly impacts the balance sheet’s retained earnings. When a company makes a profit, those earnings increase retained earnings, boosting shareholders’ equity. Conversely, a loss reduces retained earnings. Understanding this interplay is essential for comprehending the accounting cycle explained.
The statement of cash flows, on the other hand, details how cash is generated and used in operating, investing, and financing activities over a period. The ending cash balance from the cash flow statement must match the cash balance reported under current assets on the balance sheet. This direct link ensures consistency across the financial reports. For instance, if a company makes a large purchase of equipment (an investing activity), its cash balance decreases, and its property, plant, and equipment (PPE) asset on the balance sheet increases. Without examining all three statements together, you only get a partial picture, potentially missing critical insights into a company’s operational efficiency, investment strategies, and overall financial trajectory. A comprehensive analysis leverages all three to paint a complete and accurate portrait of financial health, far surpassing the limitations of looking at just one statement in isolation.
What is the primary purpose of a balance sheet?
The primary purpose of a balance sheet is to present a snapshot of a company’s financial position at a specific point in time. It details what the company owns (assets), what it owes (liabilities), and the owner’s stake (equity), adhering to the fundamental accounting equation: Assets = Liabilities + Equity.
How do current assets differ from non-current assets?
Current assets are those that are expected to be converted into cash, sold, or consumed within one year or one operating cycle, whichever is longer (e.g., cash, accounts receivable, inventory). Non-current assets, also known as long-term assets, are those not expected to be converted into cash within one year and are used for long-term operations (e.g., property, plant, equipment, long-term investments).
Why is retained earnings important on a balance sheet?
Retained earnings represent the cumulative net income (profits) of a company that has been held onto and reinvested in the business, rather than being distributed to shareholders as dividends. It’s a crucial component of shareholders’ equity, indicating a company’s ability to generate profit and fund its growth internally, reflecting its long-term financial health and sustainability.
Can a balance sheet predict a company’s future performance?
While a balance sheet provides valuable insights into a company’s financial health and stability, it is a historical snapshot and does not directly predict future performance. It serves as a foundation for analysis, especially when compared with past balance sheets and in conjunction with income statements and cash flow statements, to identify trends and inform future outlooks. However, external market factors and other qualitative elements also heavily influence future performance.
What are common red flags to look for when reading a balance sheet?
Key red flags include rapidly increasing liabilities without a corresponding increase in assets, a significant decline in cash or current assets, consistently shrinking shareholders’ equity, and a high debt-to-equity ratio compared to industry averages. These can indicate potential liquidity issues, excessive leverage, or declining profitability, signaling a need for further investigation into the company’s financial management.